

Blog
Nature Scavenger Hunt for Kids: The BioBlitz Method (8 Citizen-Science Stations + Free Field Journal PDF)
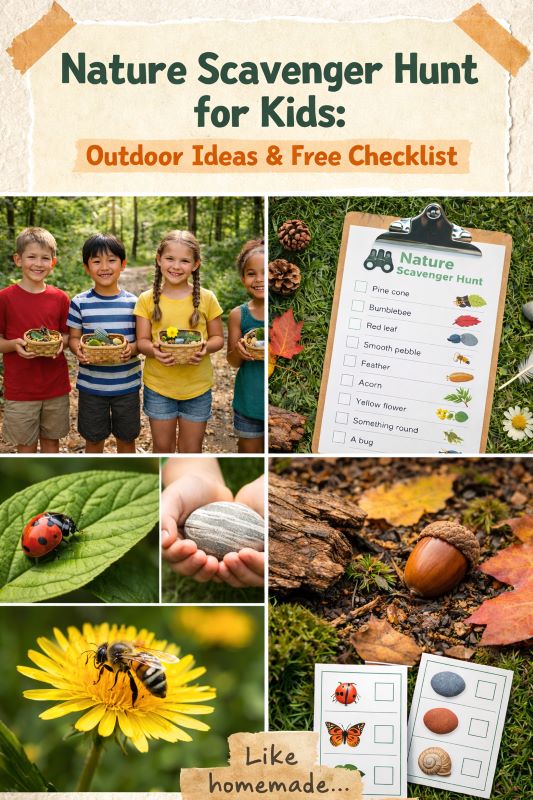
Last updated: May 2026 | 18 min read | 8-station BioBlitz framework + free Field Journal PDF
About this guide: I’ve run outdoor scavenger hunts in backyards, state parks, and schoolyards for groups ranging from 6 to 40 kids. The BioBlitz framework here is adapted from actual citizen science protocols used by the National Wildlife Federation and iNaturalist school programs — the same methodology real ecologists use when surveying biodiversity, scaled for ages 5 and up.
Most nature scavenger hunts hand kids a checklist of “find a bird, find a leaf, find a bug” — and they’re bored within ten minutes.
The reason those lists fail isn’t the outdoors. It’s the lack of purpose. Kids don’t just want to find things — they want to do something with what they find. Real scientists don’t just spot a beetle and move on. They observe it, classify it, record it, and report it.
That’s the principle behind the Backyard BioBlitz method. A BioBlitz is a timed biodiversity survey — a real scientific practice used by the National Park Service, iNaturalist, and hundreds of schools across the US. In a BioBlitz, participants try to identify every living species in a defined area within a set time window.
This post shows you how to turn that concept into 8 structured outdoor stations that keep kids fully engaged for 90 minutes — and leave them with a real field report they made themselves.
📥 Download the Free BioBlitz Field Journal PDF (16 Pages, All 8 Stations + Species Tally) →
Quick Facts
- Ages: 5—12 (calibration guidance below by age group)
- Players: 4—20 kids (teams of 3—4 work best)
- Duration: 75—90 minutes for all 8 stations
- Location: Backyard, park, nature trail, schoolyard
- Equipment: Magnifying glasses, field journals, hand lenses, specimen bags
- Best season: Spring and fall for maximum species diversity
- Science connection: Ecology, biology, data collection, scientific method

The BioBlitz Framework: How It Works
Before the hunt begins, give each team three things:
- A Field Dossier — their team name (choose a local animal: Team Red-tailed Hawk, Team Eastern Box Turtle, Team Luna Moth) and a printed Field Journal with one page per station
- A Species Tally Sheet — a running count of every distinct organism they encounter
- A Mission Briefing — “You are junior naturalists on a 90-minute biodiversity survey. Your goal: document as many species as possible and complete all 8 field stations.”
Setting Up the BioBlitz Command Board
Post a large sheet of paper or whiteboard as the “Species Board.” Each team adds their species to the board as they move through stations. At the end, you tally the total unique species found by all teams combined — that’s your BioBlitz count. The goal is to beat a target number you set in advance (e.g., “Can we find 30 species today?”). This communal goal turns individual station work into a collective scientific achievement.
Each station below takes 8—10 minutes and has a data-collection component: kids don’t just complete a task and move on — they record something in their field journal. That recorded data becomes part of their Final Field Report (Station 8).
The 8 BioBlitz Stations
Leaf Morphology Survey
The real science: Botanists identify plants by leaf architecture before looking at anything else. Three key features — blade shape, margin type, and venation pattern — allow identification of plant families even without flowers or fruit present.
Setup: Collect 10—15 different leaves before the hunt and lay them on a table or ground cloth. Provide a Leaf ID Reference Card showing three margin types (serrate/toothed, entire/smooth, lobed) and two venation types (pinnate/parallel).
The task: Teams sort the leaves into margin categories, then sketch one leaf per category in their field journal, labeling the features. Bonus: try to match any leaf to a plant in the area using a Peterson field guide page or a printed plant ID sheet.
Data recorded: 3 leaf sketches with labeled features; number of distinct leaf types identified.
Bird Behavior Watch (eBird Protocol)
The real science: Cornell Lab of Ornithology’s eBird program — the world’s largest citizen science database — asks observers to record not just species, but behaviors: feeding, singing, nest activity, or in flight. This behavioral data tells researchers about habitat quality and seasonal patterns.
Setup: Designate a “watch zone” — a tree, shrub cluster, or feeder area. Print a simple behavior code card: F=feeding, S=singing/calling, N=near nest material, M=moving/in flight, I=interaction with other bird.
The task: Teams observe the zone for exactly 5 minutes (time this strictly). They record every bird seen: species if known, or description (“small brown bird, white belly”), plus behavior code. Minimum 3 observations required.
Data recorded: Tally of bird observations with species/description and behavior codes; total observation minutes logged.

Soil Texture Analysis (The Ribbon Test)
The real science: Soil scientists classify soil texture by the ratio of sand, silt, and clay particles. The “ribbon test” is a standard field method: you moisten a small amount of soil and try to roll it into a ribbon between thumb and forefinger. Sandy soil crumbles immediately; silt makes a short ribbon; clay makes a long, smooth ribbon. The result determines drainage capacity, root penetration, and which plants can grow there.
Setup: Collect small soil samples from 3 different spots (under a tree, in an open area, near a garden bed). Provide a small cup of water and a Soil Texture Key printout showing the ribbon test decision tree.
The task: Teams test each sample using the ribbon method, classify it (sandy loam / loam / clay), and record which plants or animals might prefer each soil type.
Data recorded: 3 soil classifications; hypothesis about which soil supports the most biodiversity.
Insect Order Census (Sweep Net Survey)
The real science: Entomologists conduct sweep net surveys by walking through vegetation and sweeping a fine-mesh net back and forth to collect insects. The specimens are sorted by order (Coleoptera=beetles, Lepidoptera=butterflies/moths, Hymenoptera=bees/wasps/ants, Diptera=flies). Order diversity is an indicator of ecosystem health.
Setup: Make a sweep net from a wire coat hanger, a wooden dowel, and a pillowcase. Alternatively, use a white sheet on the ground and disturb nearby vegetation. Provide an Insect Order Reference Card with illustrations of the six most common orders.
The task: Teams make 10 sweeps through low vegetation (or beat bushes over the white sheet) and collect specimens in a clear container. They count and classify by order, then release everything. Minimum 3 different orders required for full points.
Data recorded: Count per order; total insect diversity score.
Plant Phenology Station
The real science: Phenology is the study of cyclic and seasonal natural phenomena — when plants bud, flower, fruit, and drop seeds. The USA National Phenology Network tracks these events across millions of observations to measure climate change effects. Volunteers use a standardized system: dormant → breaking leaf buds → open flowers → fruits present → recent fruit/seed drop.
Setup: Select 4—5 plants/trees in the yard or park ahead of time (they don’t need to be identified by name). Mark each with a numbered stake or flag. Print the phenology code key.
The task: Teams visit each numbered plant and record its current phenological stage using the code system. They also estimate percentage of leaves out (0%, 25%, 50%, 75%, 100%) — another real data point used by the National Phenology Network’s “Leaf Out” campaign.
Data recorded: Phenology stage code + leaf-out percentage for 4—5 plants; season hypothesis based on observed stages.

Track & Sign Identification
The real science: Wildlife biologists use animal sign — footprints, scat, rub marks, chewed vegetation, dens/burrows — to determine species presence and relative abundance without ever seeing the animal directly. A single scat sample can reveal diet, species, and approximate age of a mammal’s visit.
Setup: Create a “Sign Station” with 8—10 printed photographs (laminate them for durability) of common animal signs: squirrel middens (cone piles), deer hoof prints, rabbit pellets, bird pellets, woodpecker holes, bark beetle galleries under bark, slug slime trails, earthworm castings. Add one or two real samples if available (a shed snakeskin, an owl pellet from a science supply store).
The task: Teams match each photograph to the animal that made it using a Sign ID Reference Card. For any real samples, they must describe what behavioral information can be inferred (e.g., “owl pellet → owl was hunting in this area at night; bones inside reveal prey species”).
Data recorded: 8 sign matches with animal name; one inference statement per real sample examined.
Microhabitat Survey (The Decomposer Layer)
The real science: The layer beneath logs, rocks, and leaf litter contains some of the highest biodiversity density of any ecosystem. Decomposer communities — isopods (roly-polies), collembolans (springtails), centipedes, millipedes, earthworms, mites, fungi, and bacteria — drive nutrient cycling for the entire ecosystem above them.
Setup: Identify 3—4 logs or large rocks in the yard beforehand. Provide magnifying glasses (10x minimum), a white tray or light-colored cloth to place specimens on, and a Decomposer ID Card showing 8 common microhabitat organisms.
The task: Teams gently flip one log/rock, observe the microhabitat for 3 minutes without touching it, then use tweezers to gently move (not harm) specimens to the white tray for closer observation. They record every distinct organism type seen and classify each as: decomposer / predator / both.
Important protocol: replace the log or rock exactly as found — these organisms depend on the stable microclimate underneath.
Data recorded: Species list from microhabitat; trophic role classification; species count added to the communal BioBlitz board.
Field Report Compilation — The BioBlitz Total
The real science: A scientific survey is only complete when the data is compiled, analyzed, and reported. Real BioBlitz events end with a “species count reveal” where all observer teams contribute their data to the communal list and discuss patterns: Which habitat had the most diversity? Which group (plants, insects, birds, decomposers) was most represented? What does the species count tell us about this area’s ecological health?
Setup: Each team brings their completed field journal to a central “reporting station” (picnic table, blanket, porch). Provide the communal Species Board and markers.
The task: Teams take turns adding their unique species to the Species Board (no duplicates — if another team already recorded it, check it off instead). Once all teams have reported, count the total. Compare to your pre-set target. Calculate a Biodiversity Index: divide total species by total area surveyed (approximate square meters) — this gives a rough species/m² density that can be compared between surveys.
Each team presents one “most interesting finding” from their data — one observation, one anomaly, or one question they still have.
Award categories: Most Species Found (any station) | Most Unusual Discovery | Best Field Sketch | Most Precise Identification
Data recorded: Compiled field report with total species count, Biodiversity Index score, and one “future research question” per team.
Decoration Ideas That Match the Science Theme
- Specimen jars: Fill mason jars with layers of sand, soil, and pebbles — instant lab decor that doubles as a soil horizons visual aid
- Field guide display: Stack 4—5 Peterson or National Audubon Society field guides as table centerpieces — kids will flip through them during breaks
- Biodiversity banner: String of photographs of local animals and plants (print from iNaturalist or a nature app like Seek)
- Naturalist kit per team: Small backpack or mesh bag with magnifying glass, folded field journal, pencil, and a hand lens — doubles as party favor
- Species tally wall: A large kraft paper sheet as the communal Species Board — leave it up for the party and give it to the birthday kid as a keepsake
- Pressed leaf garland: Press leaves from the yard 1—2 days ahead and string with twine — connects the decoration to the actual survey location
Snacks That Fit the Naturalist Theme
- Trail mix stations: Set out components (nuts, dried berries, seeds, chocolate chips) and have kids build their own “field rations” — label the ingredients with their ecosystem origin
- Herb garden lemonade: Infuse lemonade with mint, basil, or lavender from a small pot — connect it to Station 5’s plant phenology
- Seed-to-snack moment: Include a sunflower seed snack alongside sunflower heads for comparison — visual connection to seed dispersal
- Dirt cups: Chocolate pudding cups with crushed Oreo “soil” layers and gummy worms — kids appreciate the decomposer layer joke after Station 7
- Leaf-shaped sandwiches: Use a leaf cookie cutter on whole wheat bread — label with a “species: Triticum aestivum” card for extra nerdy fun
Age Calibration Guide
Ages 5—7
Simplify station tasks: leaf sorting by color and size (skip margin terminology), observation-only for birds (count, no codes), and magnifying glass exploration at microhabitat station without classification. Pair with an older buddy. Field journal = drawing, not writing.
Ages 8—10
Full station tasks as written. Use the provided reference cards. Expect genuine engagement with the soil ribbon test and insect census. Field journal = drawing + simple labels. Competitive team format works well.
Ages 11—12
Add challenge layers: research species on iNaturalist during the event (if devices allowed), calculate actual species density per square meter at Station 8, and require one hypothesis statement per station (“I predict this because…”). Field journal = full scientific notation.
Ready-to-Print Forest Scavenger Hunt Kit
Our Forest Treasure Hunt includes 8 outdoor station cards, a nature field journal template, species tally sheet, and team dossiers — designed for ages 5—12, instant download.
15-Minute Quick-Start Setup
You do not need a science degree or a forest to run a BioBlitz. Here is the fastest path from idea to running hunt:
- Pick a 500-square-foot patch — backyard, schoolyard corner, urban park section, even a balcony with potted plants.
- Print the free Field Journal PDF (one per team — page per station; about 16 pages total).
- Set up the Species Board — large kraft paper, whiteboard, or even a kitchen window. Write a target number (“Can we find 30 species today?”).
- Pre-walk the route 5 minutes ahead to confirm each station has its raw material (a log, a feeder, a leafy plant, etc.).
- Hand each team their Field Dossier (team name + journal + species tally sheet) and read the Mission Briefing aloud.
- Set a 90-minute timer. Rotate teams across stations every 10 minutes. End with Station 8's communal compilation.
Seasonal Variations: How to Adapt the Hunt by Time of Year
Each season changes which stations shine. Use this quick guide to pick the right emphasis:
| Season | Strongest stations | Adjustment |
|---|---|---|
| 🌱 Spring (Mar–May) | Leaf Morphology, Phenology, Insect Census | Focus on leaf-out percentage; track first-bloom dates. |
| ☀️ Summer (Jun–Aug) | Insect Census, Bird Watch, Microhabitat | Sweep nets at peak insect activity; early-morning birding window. |
| 🍂 Autumn (Sep–Nov) | Leaf Morphology, Phenology, Track & Sign | Replace leaf-out with leaf-color and seed-drop stages. |
| ❄️ Winter (Dec–Feb) | Track & Sign, Bird Watch, Microhabitat | Snow makes tracks crystal-clear; bark + bud ID replaces leaves. |
6 Mistakes Hosts Make With Nature Hunts (And How to Avoid Them)
- Treating identification as the goal. Observation comes first. A description of an unknown insect (“brown, 6 legs, 1 cm”) is valid citizen-science data.
- Skipping the species board reveal. The communal tally at Station 8 is the emotional peak. Do not rush it.
- Letting kids touch every specimen. Use the "observe-do-not-touch" rule. Magnifying glasses + white trays keep both kids and creatures safe.
- Ignoring the science tip boxes. Those are conversation starters during station downtime — read them aloud to the team.
- Not pre-walking the route. A 5-minute scout catches missing logs, broken sweep nets, or risky terrain.
- Forgetting the "leave it better" rule. Replace every flipped rock and log. Return specimens to their habitat. Citizen science only works if the habitat survives.
Essential Gear Checklist
- 📒 Field journals (1 per team — printed from the free PDF)
- 🔍 Magnifying glasses (10× minimum) — 1 per kid ideally
- 🎒 Specimen bags or jars (clean, with breathing holes)
- 🧤 Tweezers + white observation tray
- 🪝 DIY sweep net (wire hanger + dowel + pillowcase)
- 📷 Camera or phone (for iNaturalist app uploads — optional)
- 📓 Reference cards: leaf margins, insect orders, bird behavior codes, animal signs (all in the free PDF)
- 🏆 Award certificates: Most Species Found / Most Unusual Discovery / Best Field Sketch / Most Precise Identification
Frequently Asked Questions
What if we’re in an urban area with limited wildlife?
Urban ecosystems are surprisingly rich. A single sidewalk crack supports pioneer plants (dandelions, plantain), invertebrates (ants, pillbugs), and birds (pigeons, House Sparrows) — all of which are valid BioBlitz species. The microhabitat station (Station 7) works especially well in urban areas: look for weedy vacant lots, tree pits, and park edges. The soil station also adapts well indoors using potted plant soil samples if you have zero outdoor access.
How do I help kids identify species they’ve never seen?
Identification is secondary to observation in this framework. If a kid finds an insect they can’t name, they record a description: “brown, 6 legs, 2 antennae, about 1cm.” That’s valid citizen science data. The iNaturalist app (free, iOS and Android) will suggest species IDs from photographs — if you allow devices at the party, it’s a powerful identification tool that also automatically contributes your observations to the global database.
What’s the minimum yard size needed for this hunt?
You can run a full BioBlitz in as little as 500 square feet of outdoor space — even a patio or balcony with potted plants supports several stations. The key is density of observation, not area size. A small urban garden edge often yields more insect diversity than a large mown lawn, because monoculture grass supports very few species compared to a mixed-plant area of the same size.
How do I handle kids who are scared of insects or worms?
Reframe it as “observing, not touching” — magnifying glasses and white observation trays allow close examination without contact. For Station 7, allow kids to draw what they see without using tweezers. Most hesitance disappears after 2—3 minutes of observation; the scientific framing (“you’re recording data, not playing with bugs”) reduces the perceived social risk for hesitant kids. Never force handling.
Can I run this in winter or when plants are dormant?
Yes — winter BioBlitzes work well with adjustments. Replace the leaf morphology station with bark pattern and twig ID (buds, lenticels, pith color). The bird behavior watch is often excellent in winter when leaves are down and birds cluster at feeders. The track & sign station is ideal in winter: snow makes tracks clear, and you can focus on evergreen species for phenology. The microhabitat station works year-round — decomposers don’t hibernate.
How much does a BioBlitz nature hunt cost to set up?
Around $0–$25 depending on what you already own. Magnifying glasses ($1–$3 from a dollar store), a DIY sweep net (wire hanger + pillowcase = free), printed field journal (free PDF), and a kraft paper Species Board ($5) cover everything. Specimen jars and binoculars are nice-to-have, not essential.
How many adults do I need to supervise a BioBlitz?
One adult per 5 kids is the comfortable ratio. For a birthday party of 10 kids you want two adults so one can rotate between stations giving identification help while the other manages the timer and Species Board.
Is iNaturalist or Seek required for this hunt?
Optional. Both apps (Seek = kid-friendly, no account; iNaturalist = full citizen-science platform) can supercharge identification, especially for ages 9+ comfortable with a phone camera. The hunt works perfectly with paper journals and reference cards alone.
Can I run this BioBlitz at a school instead of a backyard?
Yes — schoolyards often work better than suburban lawns because edge habitats (fence lines, drainage areas, tree pits) host more species than mown grass. Many schools officially register their BioBlitz with iNaturalist's School Programs to contribute real research data.
What if it starts to rain during the hunt?
Pause Station 2 (Bird Watch — birds shelter and disappear from feeders) and amplify Station 7 (Microhabitat — decomposers love wet conditions and emerge under wet logs). Light rain actually improves insect-survey conditions for slugs, snails, and earthworms. Heavy rain — pivot to indoor identification activities using the field guides.
Can a BioBlitz contribute to real scientific research?
Yes — observations uploaded to iNaturalist with photos are reviewed by experts and become part of the global biodiversity database used in over 1,000 published research papers. The Cornell Lab eBird database accepts your Station 2 bird observations. The USA National Phenology Network accepts your Station 5 leaf-out data. Kids genuinely contribute to science.
How is the BioBlitz different from a regular nature scavenger hunt?
A regular scavenger hunt is a checklist: “find a bird, find a leaf, find a bug.” A BioBlitz is structured fieldwork with a method, data collection, and a final report. Kids do not just spot — they observe, classify, record, and compare. Same outdoor space, far deeper engagement and learning.
Forest Treasure Hunt
Printable scavenger hunt — print at home, play in minutes. Includes clues, treasure map, certificates & more.
Sources & Further Reading
- National Park Service BioBlitz Program — nps.gov/subjects/biodiversity/national-parks-bioblitz
- iNaturalist School Programs — inaturalist.org/pages/education
- Cornell Lab of Ornithology eBird Protocol — ebird.org
- USA National Phenology Network — usanpn.org
- USDA Soil Texture Field Assessment Guide — nrcs.usda.gov
- National Wildlife Federation Certified Wildlife Habitat Program — nwf.org/garden-for-wildlife